Urban Heat Islands (UHI) are a climatic phenomenon where urban areas exhibit significantly higher temperatures than their rural surroundings. This effect is primarily driven by urbanization, the reduction of green spaces, the prevalence of heat-retaining materials such as concrete and asphalt, and human activities. This study analyzes the UHI effect in Los Mochis, Sinaloa, México through temperature monitoring at three meteorological stations across different periods of the year. Spatial data processing and analysis were conducted using ArcMap 10.2, enabling the creation of thermal distribution maps and the identification of temperature variation patterns within the urban landscape. The results confirm the presence of the UHI effect, with urbanized zones recording consistently higher temperatures than less developed areas. The highest temperature, 39.53°C, was observed between July and September, whereas the maximum recorded during January-February was 28.62°C. Temperature variations also fluctuated depending on the time of day, with the highest value occurring at midday and in the afternoon. The study highlights the necessity of implementing mitigation strategies to counteract UHI effects, such as increasing green areas, incorporating reflective materials in infrastructure, and promoting sustainable urban design. These measures are essential for enhancing urban climate resilience and improving the quality of life in affected areas.
This is an Open Access article, distributed under the terms of the Creative Commons Attribution 4.0 International License (http://creativecommons.org/licenses/by/4.0/), which permits unrestricted use, distribution and reproduction in any medium or format, provided the original work is properly cited.
Spatial Analysis, Urban Heat Islands, Urban Temperature
1. Introduction
Climate change is an undeniable reality, and human adaptability will be crucial in determining how effectively we respond to the new challenges it poses for urban climatology. Urbanization leads to significant changes in land use; as built-up areas expand, the amount of space dedicated to vegetation diminishes. This shift alters the energy balance, disrupts natural habitats, and diminishes the aesthetic value of urban landscapes
[1]
Mercado, L., Marincic, I. Morfología de isla de calor urbana en Hermosillo, Sonora y su aporte hacia una ciudad sustentable. Biotecnia. 2017, 19, 27-33.
[1]
.
In recent years, the Urban Heat Island (UHI) phenomenon has garnered considerable attention from researchers. UHI refers to the increase in air temperatures within cities compared to surrounding rural areas. This effect is primarily caused by the proliferation of urban surfaces—such as asphalt and concrete—that absorb and retain heat, thereby exacerbating a range of urban environmental issues. In cities with colder climates, UHI may yield some benefits, such as reduced demand for residential heating. However, in cities with consistently warm climates, it leads to increased air conditioning (AC) use, which transfers indoor heat to the outdoor environment. On a broader scale, heightened electricity consumption for AC systems contributes to elevated greenhouse gas (GHG) emissions, particularly in regions reliant on fossil fuel-based power generation
[2]
Roth, M., T. L. Chow, W. A historical review and assessment of urban heat island research in Singapore. Singapore Journal of Tropical Geography. 2012, 33, 381-397.
As a result, the UHI effect in warm climates tends to worsen thermal discomfort and increase the incidence of heat-related illnesses. Moreover, in all urban environments, additional heat may stimulate ecological activity by altering the distribution of local flora and fauna. It can also accelerate chemical reactions that exacerbate air pollution, such as the formation of ground-level ozone.
The UHI phenomenon represents a global challenge that threatens the functionality, livability, and sustainability of urban ecosystems. It has far-reaching implications for human comfort, public health, air quality, energy consumption, and city planning. UHI intensity is influenced by both meteorological conditions and environmental characteristics, including building materials, vegetation coverage, and traffic density. During heat waves, factors such as limited vegetation and low surface moisture have been identified as major contributors to the development of UHI. When metropolitan areas consistently record higher temperatures than nearby rural zones, the UHI effect is in full manifestation. The primary drivers of this phenomenon are heat absorption by urban structures and heat emissions generated by human activity
[3]
Khaled, H., Hamoodi, M., Al-Hameedawi, A. Urban heat islands: a review of contributing factors, effects and data. IOP Conf. Series: Earth and Environmental Science. 2023, 1-9.
A viable policy approach could involve upgrading homes with energy-efficient technologies, implementing heat pumps, and initiating early interventions before heat waves affect the region. Warmer temperatures may present both challenges and benefits in winter, particularly regarding energy consumption and demand. Milder winters could potentially reduce heating needs and help offset the high energy loads previously associated with colder seasons
[4]
Nock, D., J. Jones Jr., A., Bouzarovski, S., Thomson, H., J. Bednar, D. Reducing Energy Burden in the Power Sector: Metrics for Assessing Energy Poverty. IEEE power & energy magazine. 2024, 22(4), 26-37.
. Consequently, the UHI effect and its associated impacts are expected to intensify in the context of a warming climate and accelerated urbanization. According to data from the World Health Organization (WHO), half of the global population currently lives in urban areas, and by 2030, it is projected that 60% of the world’s population will reside in cities. Moreover, it is essential to recognize that urban thermal stress poses a serious public health risk. Case studies across various cities indicate that heat exposure, like many environmental hazards, is not evenly distributed among different socioeconomic groups. Urban areas are typically hotter than their surrounding rural counterparts. For instance, in the United States, heat-related mortality results in approximately 1,500 deaths per year, exceeding fatalities from other extreme weather events. Additionally, heat exposure is associated with a variety of non-lethal health issues, including heat stroke, dehydration, reduced labor productivity, and impaired learning performance
[5]
Hsu, A., Sheriff, G., Chakraborty, T., Manya, D. Disproportionate exposure to urban heat island intensity across major US cities. Nature Communications. 2021, 12, 2721.
. In Mexico, UHIs represent a growing concern due to rapid urban expansion, the decline of green spaces, and the proliferation of impervious surfaces such as concrete and asphalt. This phenomenon significantly affects public health, energy consumption, and air quality. These consequences underscore the urgent need for effective mitigation strategies, including urban reforestation, the promotion of sustainable building practices, and the use of reflective paving materials.
The UHI effect has direct implications for public health, energy consumption, and environmental quality, UHI exacerbates heat-related health issues, increases electricity demand for cooling, and contributes to the urban population’s vulnerability to climate change
[6]
Khalid, M., Nassani, A., Al-Aiban, K., Zaman, K., Haffarf, M. Urban heat islands and energy consumption patterns: Evaluating renewable energy strategies for a sustainable future. Energy Reports. 2025, 13, 3760–3772.
Therefore, the primary objective of this research is to analyze and quantify the UHI effect in Los Mochis, Sinaloa, Mexico. By utilizing meteorological data and conducting spatial analysis through Geographic Information Systems (GIS) technology, specifically ArcMap, the study aims to identify spatial temperature distributions and the intensity of the UHI across different seasons. This research seeks to generate data-driven insights that enhance the understanding of urban climate dynamics and to provide a robust scientific basis for sustainable urban planning and effective climate adaptation strategies. Understanding the distribution and intensity of the UHI is essential for developing mitigation policies, enabling the exploration of research questions such as: Which areas of the city exhibit the highest and lowest temperature variations? To what extent does the Urban Heat Island effect manifest in Los Mochis, Sinaloa, across different seasons? Addressing these questions will allow local governments to implement evidence-based strategies to combat the UHI effect, thereby promoting urban resilience.
2. Background
UHIs, linked to rapid urbanization, have drawn attention to their role in raising temperatures in both urban and rural areas
[7]
Mirzaei, P. Recent challenges in modeling of urban heat island. Sustainable Cities and Society. 2015, 19.
Morris, K., Salleh, S., Chan, A., Ooi, M., Abakr, Y., Oozeer, Y., Duda, M. Computational study of urban heat island of Putrajaya, Malaysia. Sustainable Cities and Society. 2015, 19, 359–372.
. With rapid urban expansion and ongoing infrastructure development, many cities are facing growing UHI-related environmental and social challenges
[9]
Aflaki, A., Mirnezhad, M., Ghaffarianhoseini, A., Ghaffarianhoseini, A., Omrany, H. Urban heat island mitigation strategies: A state-of-the-art review on Kuala Lumpur, Singapore and Hong Kong. Cities. 2016, 62, 131-145.
. Thus, understanding how landscape patterns influence the thermal environment is essential for improving urban ecological conditions
[10]
Yang, L., Yu, K., Ai, J., Liu, Y., Lin, L., Lin, L., Liu, J. The Influence of Green Space Patterns on Land Surface Temperature in Different Seasons: A Case Study of Fuzhou City, China. Remote Sens. 2021, 13(24), 5114.
Conversely, other studies have evaluated the effectiveness of green spaces and commercial infrastructure in mitigating temperature fluctuations. This study uses ArcGIS software to map data, perform spatial analysis through cloud-based mapping, and produce visual representations with geographic information systems (GIS) to promote greater insight on the formulation of goals and policy making for strategic management
[11]
Teo, Y. H., Makani, M. A., Wang, W., Liu, L., Yap, J. H., Cheong, K. H. Urban Heat Island Mitigation: GIS-Based Analysis for a Tropical City Singapore. Int. J. Environ. Res. Public Health. 2022, 19, 11917.
. Additionally, research utilizing heat maps to analyze the average temperature increase due to UHI effects in Salt Lake City has demonstrated that extreme heat represents a serious threat and is expected to become increasingly frequent as climate change progresses. Neighborhoods in Salt Lake City located at higher elevations tend to experience more moderate heating effects and exhibit higher average household incomes
[12]
Farley, A., Belnap, H., Parvania, M. Resilience Hubs: Bolstering the Grid and Empowering Communities. IEEE Power and Energy Magazine. 2024, 22(4), 38-48.
By processing high- and low-resolution satellite imagery, a detailed analysis of UHI intensity has been conducted, emphasizing the importance of remote sensing technologies in delineating UHI boundaries. This study aims to identify the areas most vulnerable to this phenomenon and examine their relationship with urban structural characteristics, which contribute to adverse health outcomes, increased pollutant dispersion, and extreme temperature events, among other impacts
[13]
Alarcón, I. G., Cos, C. A., Fernández, S. L., Jiménez, F. G., Escamilla, J. A. The surface urban heat island and its manifestation in the urban structure of Mexico City. Revista de ciencias tecnológicas (RECIT). 2022, 5(3), e227.
Aragón, J., Rodríguez, E. D., Varon, G. A., Sánchez, G. A. Análisis de islas de calor por medio de imágenes satelitales y sistemas de información geográficos en el área urbana de la Sabana de Bogotá. Geographicalia. 2020, 72, 39-64.
. Furthermore, a historical review of surface urban heat island studies using satellite data is also included, covering temporal trends, geographic scope, study periods, and research methods. The influence of public and private green spaces on surface temperature (ST) has also been examined
[15]
Zhou, D., Xiao, J., Bonafoni, S., Berger, C., Deilami, K., Zhou, Y., Sobrino, J. A. Satellite Remote Sensing of Surface Urban Heat Islands: Progress, Challenges, and Perspectives. Remote Sens. 2019, 11(48).
Reyes, C., Rosas, M., López, P., Prieto, J., Hinojosa, F., Vega, D. Analysis of the land surface temperature in the green areas of Durango city, state of Durango. Revista Mexicana de Ciencias Forestales. 2024, 15(85), 81-109.
. Considering that UHIs are closely linked to several Sustainable Development Goals (SDGs) outlined in the 2030 Agenda—particularly those related to climate action, health and well-being, and sustainable cities—this study aims to analyze and monitor UHIs using GIS to assess temperature dynamics in Los Mochis, Sinaloa, Mexico. The insights gained will support the development of strategies for managing and mitigating their impact on the regional climate.
3. Materials and Methods
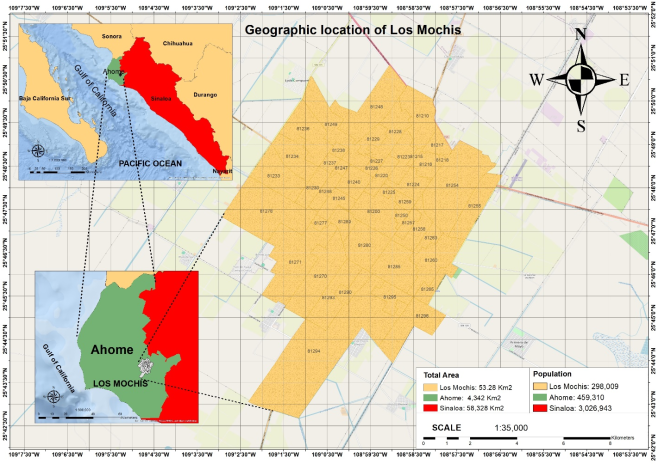
This research was carried out in Los Mochis, Sinaloa, Mexico, located within the municipality of Ahome. According to the Municipal Planning Institute of Ahome (IMPLAN), Los Mochis is situated in the northern part of Sinaloa, at 25°47’37” N latitude and 108°59’49” W longitude, with an average elevation of 14 meters above sea level.
With a population of 298,009, Los Mochis represents 64.88% of the municipality’s total population. The city experiences an arid climate, marked by high evaporation rates that create a warm-humid microclimate for most of the year. The study area, illustrated in Figure 1, includes key urban characteristics such as city layout, transportation routes, and urban boundaries, incorporating essential geostatistical units.
Figure 1. Geographic Location of the Study Area in Los Mochis.
The study employed a quantitative approach with an experimental design, utilizing both on-site and remote measurement and analysis tools to assess the intensity of UHIs effect in Los Mochis.
Monthly average temperatures were calculated and grouped by season: July to September (summer), October to December (autumn), and January to February (winter). This seasonal grouping enables broader temperature analysis beyond daily or weekly fluctuations, providing more accurate insights into the relationship between urbanization and the UHI phenomenon
[17]
Rosas Villar, I., Pérez Campuzano, E. Urban Heat Islands and their territorial links with the urban and sociodemographic system of the Central Region of Mexico. Boletín de la Asociación de Geógrafos Españoles(100). 2024, 1-38.
After retrieving the data stored by the meteorological stations and calculating monthly average temperatures, the information was processed using ArcMap 10.8 software. The projection and coordinate system corresponding to the study area were defined
[18]
Reyes, C., Rosas, M., López, P., Prieto, J., Hinojosa, F., Vega, D. Analysis of the land surface temperature in the green areas of Durango city, state of Durango. Revista Mexicana de Ciencias Forestales. 2024, 15(85), 81-109.
Subsequently, the Inverse Distance Weighted (IDW) interpolation method was applied, using a search radius that included three strategically located weather stations within the city, as shown in Table 1.
Table 1. Weather stations.
Weather Station
Latitude
Longitude
Zip Code
ILOSMO10
25.768068
-108.99733
81293
ILOSMO11
25.785068
-108.97755
81257
ILOSMO12
25.795465
-109.01875
81230
4. Results
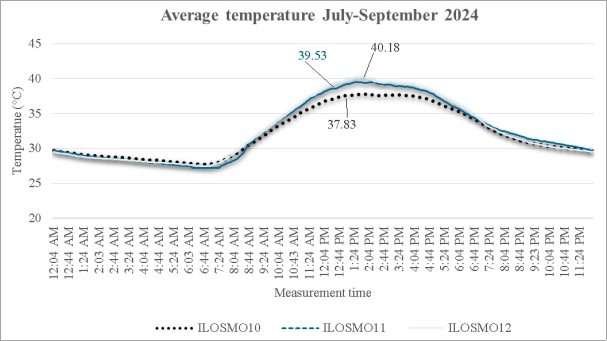
Temperature patterns in Los Mochis were analyzed for three periods: July to September 2024, October to December 2024, and January to February 2025, using data collected from three monitoring stations. The results revealed predictable daily variations, with minimum temperatures around 30°C in the early morning and a maximum of 40.18°C recorded at midday. Slight temperature differences were observed between stations, indicating the influence of urban and environmental factors on heat distribution (Figure 2).
Figure 2. Average temperature July-September 2024.
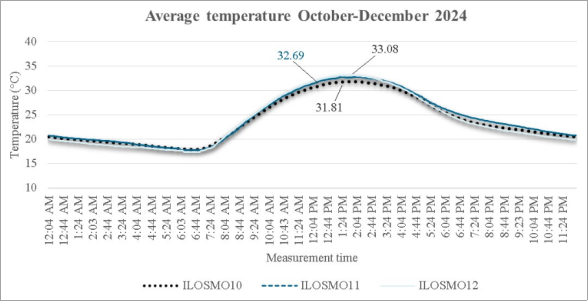
A typical thermal pattern emerged, with the lowest temperatures occurring at dawn and a gradual increase until peaking between 12:00 p.m. and 2:00 p.m., followed by a steady decline in the evening (Figure 3). During this period, the minimum temperature was approximately 15°C, while the maximum reached 29.13°C. Compared to the warmer months (July–September), temperatures were significantly lower, reflecting the seasonal nature of the regional climate in December.
Figure 3. Average temperature October-December 2024.
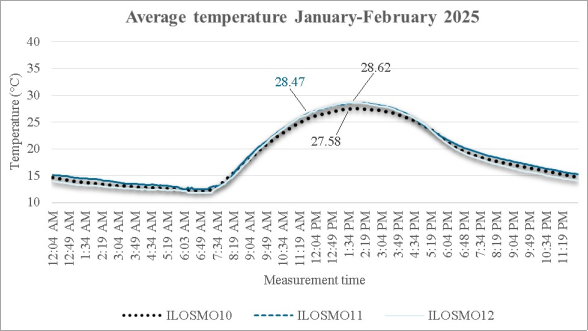
In contrast, Figure 4 illustrates average temperature variations in Los Mochis during January to February 2025. Daily average temperatures ranged from 15°C to 28.62°C, with an intermediate value of approximately 21–22°C sustained for most of the day. The temperature curve displayed a positively skewed distribution in the early hours, peaking in the afternoon and symmetrically declining thereafter. The thermal distribution was homogeneous across all stations, with only minor variations between them. Compared to the July-September 2024 period, winter temperatures were lower—by about 11°C in maximum values. Furthermore, the narrower temperature range indicated lower thermal variability. When compared to the October–December 2024 period, temperatures in January–February were slightly lower, confirming this as the coldest time of the year.
Figure 4. Average temperature January-February 2025.
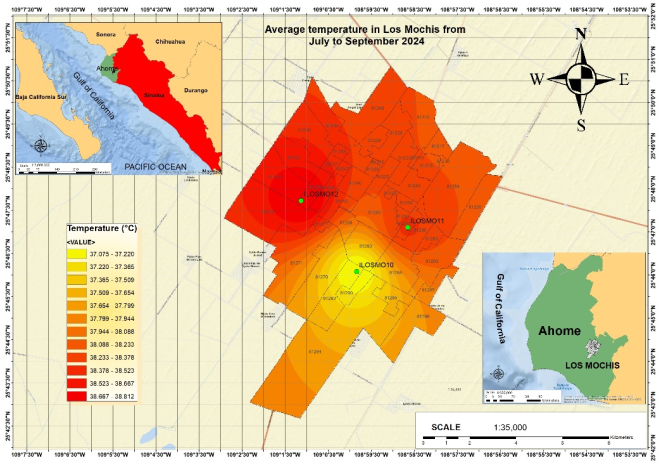
For the geospatial analysis using ArcMap 10.2, Figure 4 presents the urban temperature map for July to September in Los Mochis. A color gradient from yellow (lower temperatures) to dark red (higher temperatures) was used, with values ranging from 37.075°C to 38.812°C. Warmer zones were concentrated in the northwest and western sectors of the city, while cooler areas were found in the southeast. Although temperature differences were not extreme, there was an approximate variation of 1.7°C between the warmest and coolest zones.
This analysis suggests that Los Mochis experiences intense heat during the summer, with minor localized variations likely influenced by urban structure and geographic characteristics.
As the area around LOSMO10 station exhibits the lowest temperatures—due to factors such as vegetation, land use, or infrastructure—an analysis of accumulated rainfall during the same period was conducted.
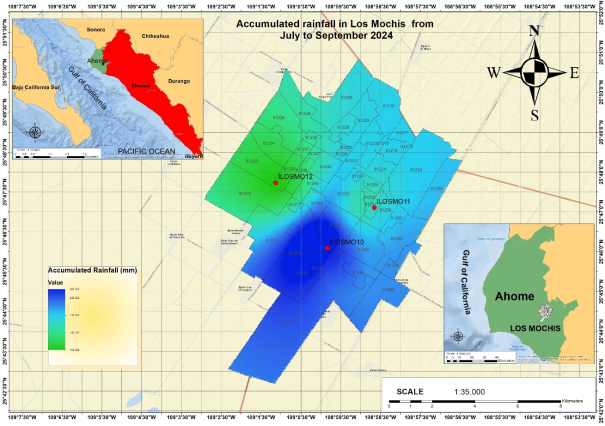
Figure 6 presents a map of accumulated precipitation from July to September in Los Mochis, Sinaloa. Precipitation levels are represented using a color gradient, with green indicating lower rainfall accumulation and dark blue representing higher levels of precipitation. Rainfall distribution across the city is uneven, resulting in significant variations in accumulated precipitation. The southwestern region (dark blue) recorded the highest rainfall, while the northwestern sector (green) experienced the lowest precipitation.
A comparison with the temperature map (Figure 5) reveals that warmer areas tend to receive less rainfall, supporting the correlation between the urban heat island effect and reduced precipitation in densely urbanized regions. Areas with more vegetation (less urbanization) may exhibit higher rainfall accumulation due to increased moisture interaction with vegetation. Additionally, meteorological factors such as low-pressure systems and localized storms contribute to spatial variations in precipitation.
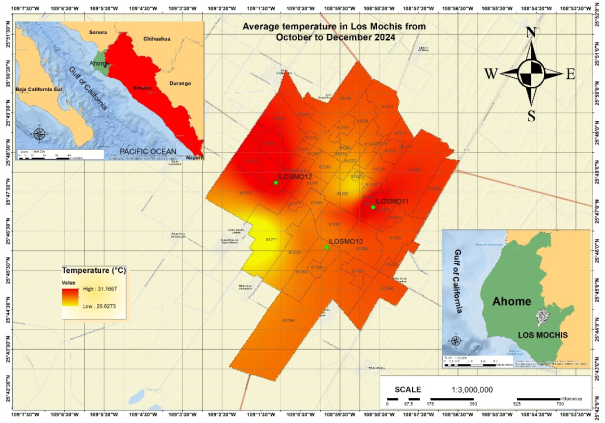
Figure 7 highlights the highest average temperatures from October to December, concentrated in the central-eastern and northwestern areas of the city, reaching approximately 31.1°C. This trend is associated with increased urbanization, the predominance of paved surfaces and buildings, and limited vegetational contributing to greater heat absorption and retention.
In contrast, the lowest average temperatures during this period, around 29.9°C, are mainly found in the southwestern and some peripheral areas. These zones likely contain more vegetation, bodies of water, or lower urban density, which favor better heat dissipation.
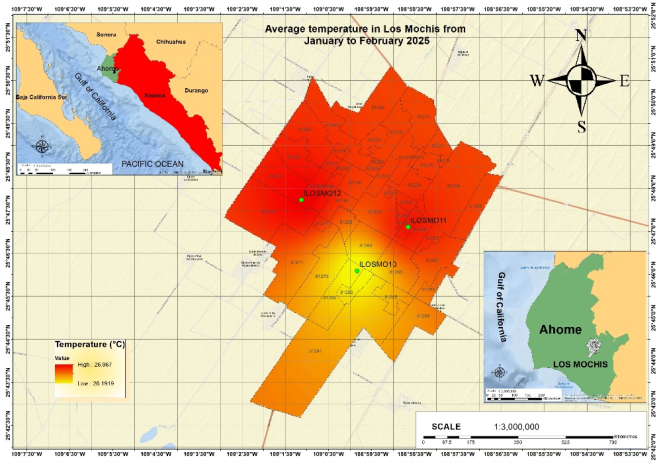
Finally, Figure 8 presents a spatial interpolation map, based on meteorological station data, modeling thermal variability in the region. It displays the average temperature from January to February in Los Mochis, Sinaloa, showing minimal variation, with values ranging from 26.19°C to 26.97°C. The map indicates a uniform temperature distribution during this period, with only slight differences between urban and peripheral zones. This type of analysis is vital for climate change research, urban planning, and thermal comfort assessment in the region.
5. Conclusions
This study examined the impact of UHI in Los Mochis, Sinaloa, by monitoring temperatures at three meteorological stations across different periods of the year. Spatial data processing and analysis were conducted using ArcMap 10.2, enabling the creation of thermal distribution maps and the visualization of temperature variation patterns in urban areas. The results demonstrated the presence of UHI effect, with higher temperatures in urbanized areas compared to less developed regions. The highest temperature was recorded between July and September, reaching a peak of 40.18°C, while the maximum in January-February was 28.62°C. Temperature variations also fluctuated depending on the time of day, with the highest readings occurring around midday and afternoon, highlighting distinct seasonal differences.
The study highlights the urgent need for strategies to mitigate the UHI effect, including the expansion of green spaces, the use of reflective materials in infrastructure, and the promotion of sustainable urban design. These measures can help reduce urban overheating and improve the quality of life for city residents.
Effectively addressing UHI requires a multidimensional approach aligned with the 2030 SDGs. Through public policies, sustainable technologies, and ecological urban planning, cities can reduce their vulnerability and move toward greater climate resilience. Rising urban temperatures increase electricity consumption due to heightened use of air conditioning and ventilation systems, leading to higher greenhouse gas emissions. Promoting energy-efficient building designs and the adoption of renewable energy sources will help lower the carbon footprint while reducing health risks such as heatstroke, respiratory illnesses, and cardiovascular conditions. In cities with extreme temperatures, heat-related mortality tends to rise, disproportionately affecting vulnerable populations.
The findings of this study provide a critical foundation for future research in urban climatology, environmental planning, and public health policy. By offering a localized understanding of UHI dynamics, this research enables future scholars to:
(1) Conduct longitudinal studies on the evolution of UHI in response to urban expansion or policy interventions.
(2) Examine the socioeconomic impacts of urban thermal disparities.
(3) Develop and evaluate localized mitigation strategies, such as green infrastructure or reflective surface technologies.
(4) Integrate UHI data into comprehensive climate adaptation frameworks.
Ultimately, this study serves as a catalyst for interdisciplinary research and policy innovation aimed at creating climate-resilient, sustainable, and livable cities.
Abbreviations
AC
Air Conditioning
GHG
Greenhouse Gas
GIS
Geographic Information System
IDW
Inverse Distance Weighted
SDGs
Sustainable Development Goals
ST
Surface Temperature
UHI
Urban Heat Island
WHO
World Health Organization
Author Contributions
Lennin Enrique Amador Castro: Data curation, Formal Analysis, Investigation, Methodology, Validation, Writing – original draft, Writing – review & editing
Román Edén Parra Galaviz: Conceptualization, Data curation, Formal Analysis, Investigation, Methodology
Alexander Mendoza Acosta: Investigation, Resources
Manuel Cota Ruiz: Conceptualization, Supervision, Validation, Visualization
Conflicts of Interest
The authors declare no conflicts of interest.
References
[1]
Mercado, L., Marincic, I. Morfología de isla de calor urbana en Hermosillo, Sonora y su aporte hacia una ciudad sustentable. Biotecnia. 2017, 19, 27-33.
[2]
Roth, M., T. L. Chow, W. A historical review and assessment of urban heat island research in Singapore. Singapore Journal of Tropical Geography. 2012, 33, 381-397.
Khaled, H., Hamoodi, M., Al-Hameedawi, A. Urban heat islands: a review of contributing factors, effects and data. IOP Conf. Series: Earth and Environmental Science. 2023, 1-9.
Nock, D., J. Jones Jr., A., Bouzarovski, S., Thomson, H., J. Bednar, D. Reducing Energy Burden in the Power Sector: Metrics for Assessing Energy Poverty. IEEE power & energy magazine. 2024, 22(4), 26-37.
Hsu, A., Sheriff, G., Chakraborty, T., Manya, D. Disproportionate exposure to urban heat island intensity across major US cities. Nature Communications. 2021, 12, 2721.
Khalid, M., Nassani, A., Al-Aiban, K., Zaman, K., Haffarf, M. Urban heat islands and energy consumption patterns: Evaluating renewable energy strategies for a sustainable future. Energy Reports. 2025, 13, 3760–3772.
Morris, K., Salleh, S., Chan, A., Ooi, M., Abakr, Y., Oozeer, Y., Duda, M. Computational study of urban heat island of Putrajaya, Malaysia. Sustainable Cities and Society. 2015, 19, 359–372.
Aflaki, A., Mirnezhad, M., Ghaffarianhoseini, A., Ghaffarianhoseini, A., Omrany, H. Urban heat island mitigation strategies: A state-of-the-art review on Kuala Lumpur, Singapore and Hong Kong. Cities. 2016, 62, 131-145.
Yang, L., Yu, K., Ai, J., Liu, Y., Lin, L., Lin, L., Liu, J. The Influence of Green Space Patterns on Land Surface Temperature in Different Seasons: A Case Study of Fuzhou City, China. Remote Sens. 2021, 13(24), 5114.
Teo, Y. H., Makani, M. A., Wang, W., Liu, L., Yap, J. H., Cheong, K. H. Urban Heat Island Mitigation: GIS-Based Analysis for a Tropical City Singapore. Int. J. Environ. Res. Public Health. 2022, 19, 11917.
Farley, A., Belnap, H., Parvania, M. Resilience Hubs: Bolstering the Grid and Empowering Communities. IEEE Power and Energy Magazine. 2024, 22(4), 38-48.
Alarcón, I. G., Cos, C. A., Fernández, S. L., Jiménez, F. G., Escamilla, J. A. The surface urban heat island and its manifestation in the urban structure of Mexico City. Revista de ciencias tecnológicas (RECIT). 2022, 5(3), e227.
Aragón, J., Rodríguez, E. D., Varon, G. A., Sánchez, G. A. Análisis de islas de calor por medio de imágenes satelitales y sistemas de información geográficos en el área urbana de la Sabana de Bogotá. Geographicalia. 2020, 72, 39-64.
Reyes, C., Rosas, M., López, P., Prieto, J., Hinojosa, F., Vega, D. Analysis of the land surface temperature in the green areas of Durango city, state of Durango. Revista Mexicana de Ciencias Forestales. 2024, 15(85), 81-109.
Rosas Villar, I., Pérez Campuzano, E. Urban Heat Islands and their territorial links with the urban and sociodemographic system of the Central Region of Mexico. Boletín de la Asociación de Geógrafos Españoles(100). 2024, 1-38.
Reyes, C., Rosas, M., López, P., Prieto, J., Hinojosa, F., Vega, D. Analysis of the land surface temperature in the green areas of Durango city, state of Durango. Revista Mexicana de Ciencias Forestales. 2024, 15(85), 81-109.
Castro, L. E. A., Galaviz, R. E. P., Acosta, A. M., Ruiz, M. C., Espinoza, I. L. (2025). Analysis of Urban Heat Islands Using Geographic Information System: Evaluation and Management of Global Climate Impact. International Journal of Sustainable Development Research, 11(2), 84-93. https://doi.org/10.11648/j.ijsdr.20251102.13
Castro, L. E. A.; Galaviz, R. E. P.; Acosta, A. M.; Ruiz, M. C.; Espinoza, I. L. Analysis of Urban Heat Islands Using Geographic Information System: Evaluation and Management of Global Climate Impact. Int. J. Sustain. Dev. Res.2025, 11(2), 84-93. doi: 10.11648/j.ijsdr.20251102.13
Castro LEA, Galaviz REP, Acosta AM, Ruiz MC, Espinoza IL. Analysis of Urban Heat Islands Using Geographic Information System: Evaluation and Management of Global Climate Impact. Int J Sustain Dev Res. 2025;11(2):84-93. doi: 10.11648/j.ijsdr.20251102.13
@article{10.11648/j.ijsdr.20251102.13,
  author = {Lennin Enrique Amador Castro and Román Edén Parra Galaviz and Alexander Mendoza Acosta and Manuel Cota Ruiz and Iduvier Lerma Espinoza},
  title = {Analysis of Urban Heat Islands Using Geographic Information System: Evaluation and Management of Global Climate Impact
},
  journal = {International Journal of Sustainable Development Research},
  volume = {11},
  number = {2},
  pages = {84-93},
  doi = {10.11648/j.ijsdr.20251102.13},
  url = {https://doi.org/10.11648/j.ijsdr.20251102.13},
  eprint = {https://article.sciencepublishinggroup.com/pdf/10.11648.j.ijsdr.20251102.13},
  abstract = {Urban Heat Islands (UHI) are a climatic phenomenon where urban areas exhibit significantly higher temperatures than their rural surroundings. This effect is primarily driven by urbanization, the reduction of green spaces, the prevalence of heat-retaining materials such as concrete and asphalt, and human activities. This study analyzes the UHI effect in Los Mochis, Sinaloa, México through temperature monitoring at three meteorological stations across different periods of the year. Spatial data processing and analysis were conducted using ArcMap 10.2, enabling the creation of thermal distribution maps and the identification of temperature variation patterns within the urban landscape. The results confirm the presence of the UHI effect, with urbanized zones recording consistently higher temperatures than less developed areas. The highest temperature, 39.53°C, was observed between July and September, whereas the maximum recorded during January-February was 28.62°C. Temperature variations also fluctuated depending on the time of day, with the highest value occurring at midday and in the afternoon. The study highlights the necessity of implementing mitigation strategies to counteract UHI effects, such as increasing green areas, incorporating reflective materials in infrastructure, and promoting sustainable urban design. These measures are essential for enhancing urban climate resilience and improving the quality of life in affected areas.
},
 year = {2025}
}
TY  - JOUR
T1  - Analysis of Urban Heat Islands Using Geographic Information System: Evaluation and Management of Global Climate Impact

AU  - Lennin Enrique Amador Castro
AU  - Román Edén Parra Galaviz
AU  - Alexander Mendoza Acosta
AU  - Manuel Cota Ruiz
AU  - Iduvier Lerma Espinoza
Y1  - 2025/04/29
PY  - 2025
N1  - https://doi.org/10.11648/j.ijsdr.20251102.13
DO  - 10.11648/j.ijsdr.20251102.13
T2  - International Journal of Sustainable Development Research
JF  - International Journal of Sustainable Development Research
JO  - International Journal of Sustainable Development Research
SP  - 84
EP  - 93
PB  - Science Publishing Group
SN  - 2575-1832
UR  - https://doi.org/10.11648/j.ijsdr.20251102.13
AB  - Urban Heat Islands (UHI) are a climatic phenomenon where urban areas exhibit significantly higher temperatures than their rural surroundings. This effect is primarily driven by urbanization, the reduction of green spaces, the prevalence of heat-retaining materials such as concrete and asphalt, and human activities. This study analyzes the UHI effect in Los Mochis, Sinaloa, México through temperature monitoring at three meteorological stations across different periods of the year. Spatial data processing and analysis were conducted using ArcMap 10.2, enabling the creation of thermal distribution maps and the identification of temperature variation patterns within the urban landscape. The results confirm the presence of the UHI effect, with urbanized zones recording consistently higher temperatures than less developed areas. The highest temperature, 39.53°C, was observed between July and September, whereas the maximum recorded during January-February was 28.62°C. Temperature variations also fluctuated depending on the time of day, with the highest value occurring at midday and in the afternoon. The study highlights the necessity of implementing mitigation strategies to counteract UHI effects, such as increasing green areas, incorporating reflective materials in infrastructure, and promoting sustainable urban design. These measures are essential for enhancing urban climate resilience and improving the quality of life in affected areas.

VL  - 11
IS  - 2
ER  -